Learn how to use the Secure Edge Portal to get detailed metrics and information for nodes (formerly iNodes), services, and containers running on a node.
- Get performance and resource usage metrics for a node, the services running on it, and the containers within each service.
- Use data saving mode to manage data usage when a node’s uplink has a data limit.
- View network and serial interfaces on a node.
View node, service, and container metrics
The following sections explain how to get node, services, and container metrics through the Secure Edge Portal.
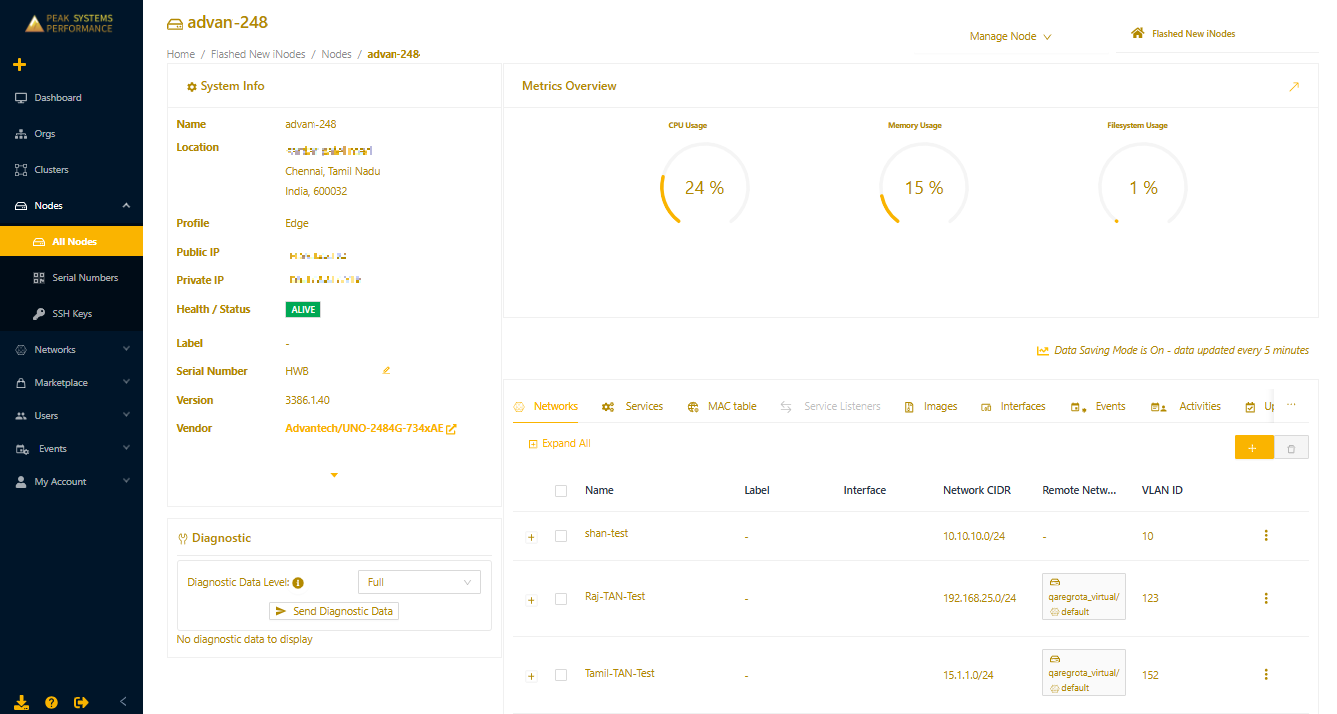
Get node-level metrics
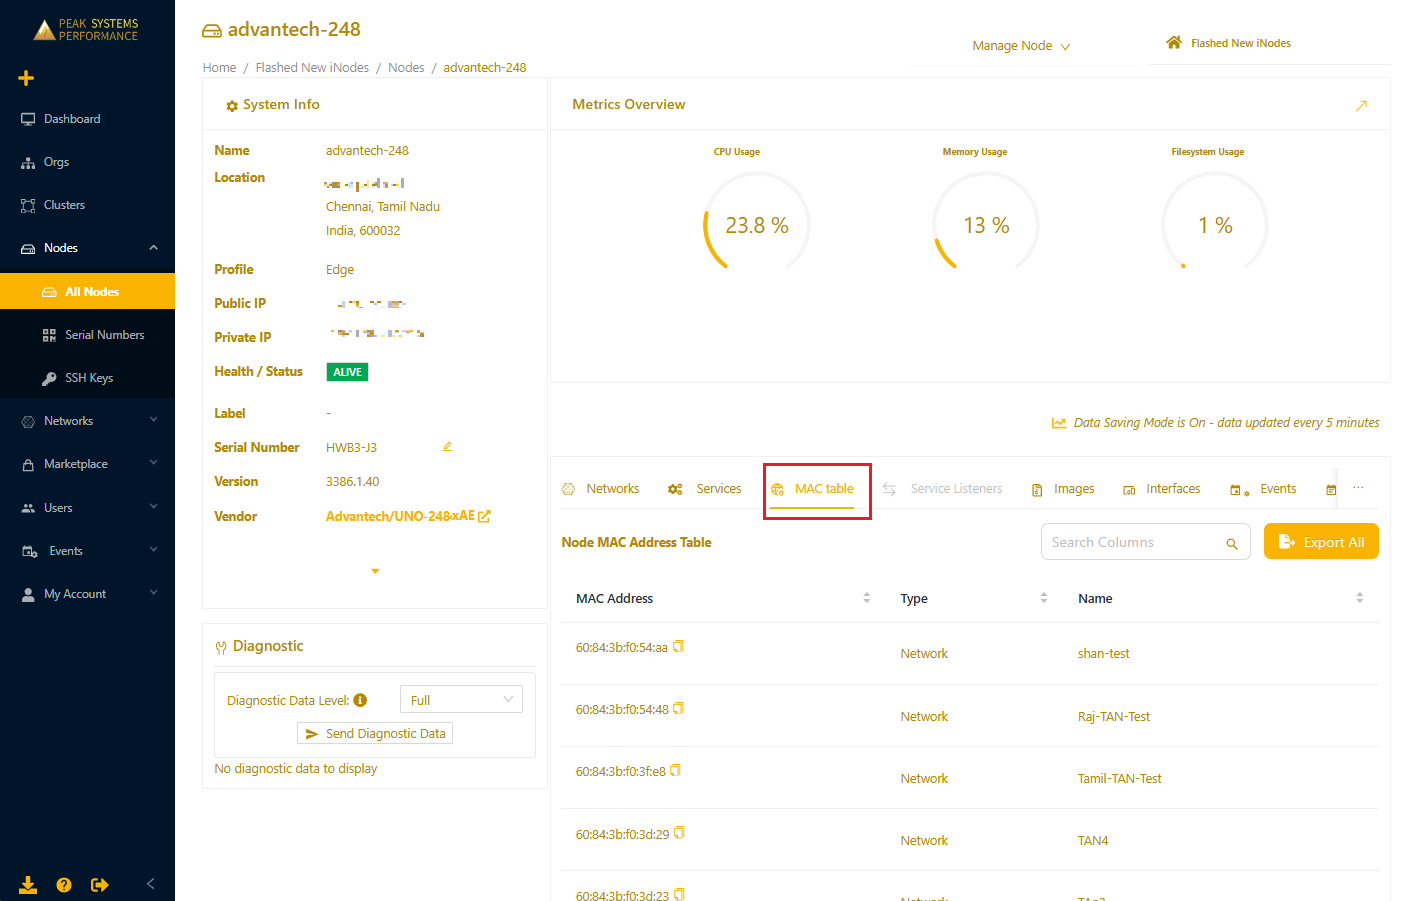
To get a node-level metrics summary, from Nodes > All Nodes, select the node name to open it details page. The metrics display is only for nodes with status ALIVE.
The Metrics Overview pane shows the node’s CPU, memory, and filesystem usage.
Get detailed metrics
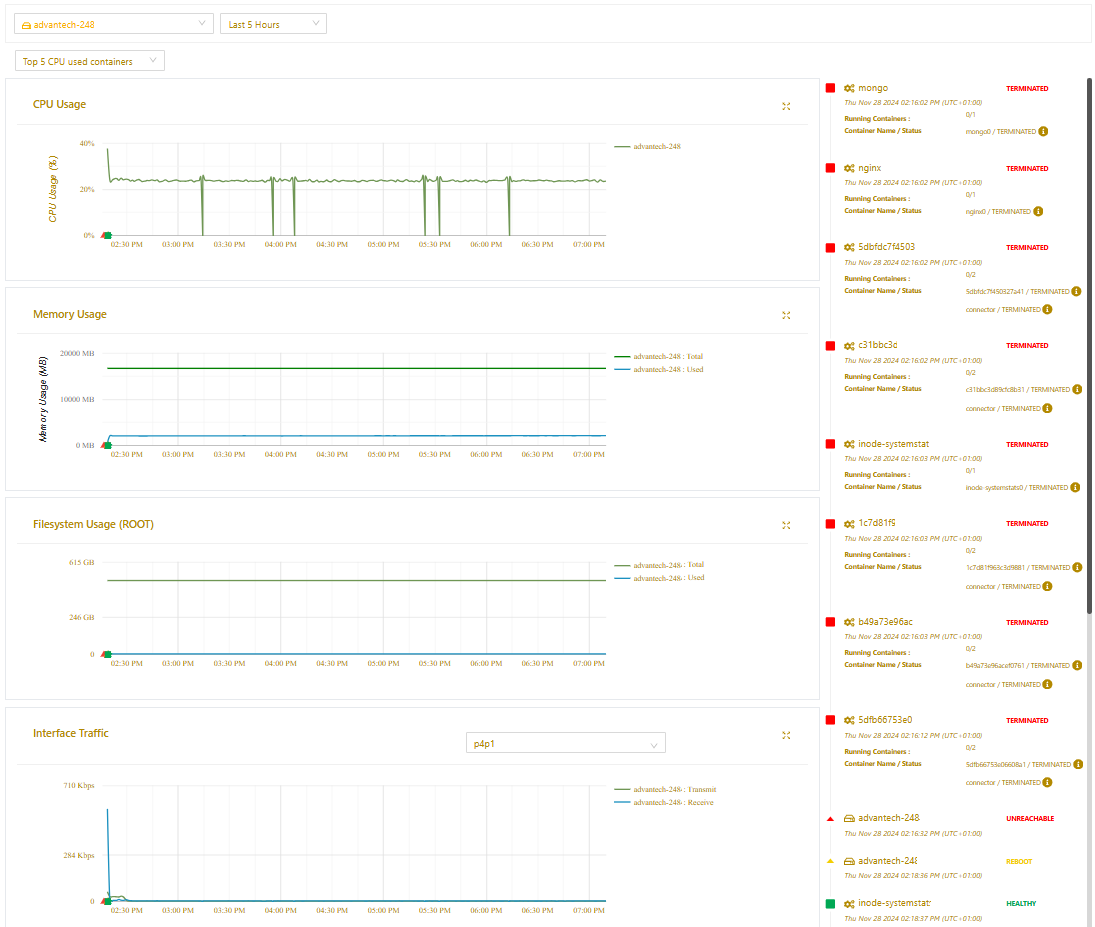
On the top right of the Metrics Overview pane, select the arrow to open the detailed Metrics Dashboard. This dashboard shows the metrics panels for the node, services, and containers, as well as historical data.
The Metrics Dashboard includes these subsections:
- <Node> Overview: CPU, memory, and filesystem usage, as well as interface traffic at the node level.
- Container Overview and Service Overview panels. Use the drop-down menus to filter for the services and containers you want to examine:
- Container Overview: Container-level CPU, memory, and filesystem usage. (Use the drop-down menu to filter for a specific container.)
- Service Overview: Service-level interface traffic transmitted and received. (Use the drop-down menu to filter for a specific service.)
- Service Status and Container Status: The status of services and containers on the node.
- Historical charts at the bottom of the page show resource usage and interface traffic over time. These charts also highlight events that occurred during the node’s runtime. Clicking on an event will link to the event timeline, helping you correlate resource usage and network/serial interface traffic with events.
- Use the top left drop-down to select the scope of the metrics you’re viewing. You can select/deselect the services and containers to view. Note that you can't select more than five at once.
- Use the second top drop-down to specify the duration for the collected metrics. In addition to Last 5 Hours, you can use Custom Range to pick From and To dates within a 48-hour span.
The following image shows historical data for a specific Edge Node (formerly Edge iNode).
You can customize the Metrics Dashboard page by selecting Manage Metrics Dashboard > Edit to add or remove widgets. If you want to reset the widgets to the default view, select Manage Metrics Dashboard > Reset options.
Use data saving mode
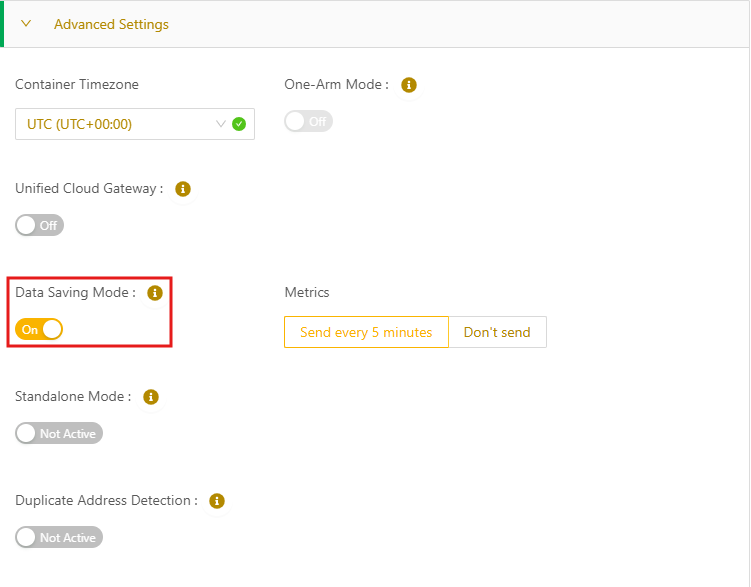
To control data usage when a node’s uplink connection has a data limit, you can enable Data Saving Mode.
- Select the node to open its details page, and then under Manage Node, select Edit.
- Expand the Advanced Settings section, and then toggle on Data Saving Mode.
- By default, none sends system and container resource utilization metrics to the Secure Edge Portal every minute. To control data usage, you can reduce this frequency to one of the following:
- Send every 5 minutes. Metrics will be sent to the portal every five minutes.
- Don’t send. No metrics will be sent.
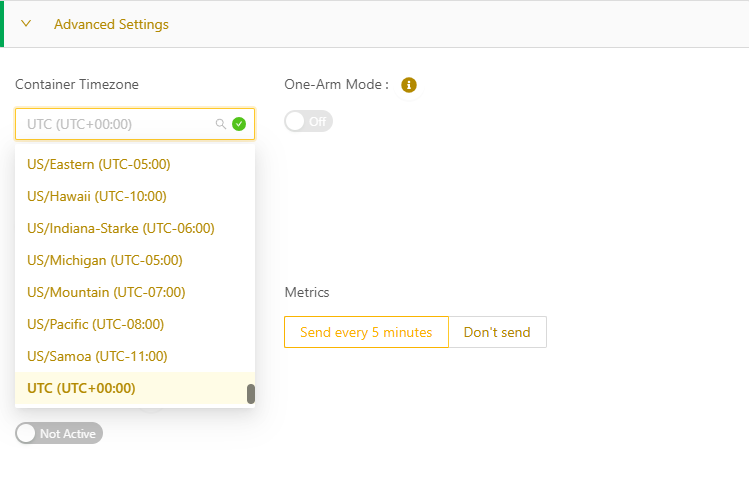
Set the container timezone on Edge Nodes
You can set the timezone for edge service containers, which will set all logs and other timestamp-related information for edge services/containers running on that node to that timezone.
To set or change the container timezone:
- Select the node to open its details page, and then under Manage Node, select Edit.
- Expand the Advanced Settings section and select the desired container timezone from the drop-down list (default is UTC).
View node interface information
To see information about a node's network and serial interfaces:
- Select the node name to open its details page, and then select the Interfaces tab to display the list of interfaces available on the node.
For each interface, you’ll find the type, hardware address, and link status..png)
- Select the plus sign (+) next to an interface to see detailed information, including (if available):
- Network interfaces: IP address, MTU size
- Ethernet interfaces: Link speed
- Wi-Fi interfaces: SSID
- Cellular interfaces: Last connected time, operator, APN, band, signal quality, IMSI, ICCID
- Serial interfaces: Flags, IRQ, UART, Port
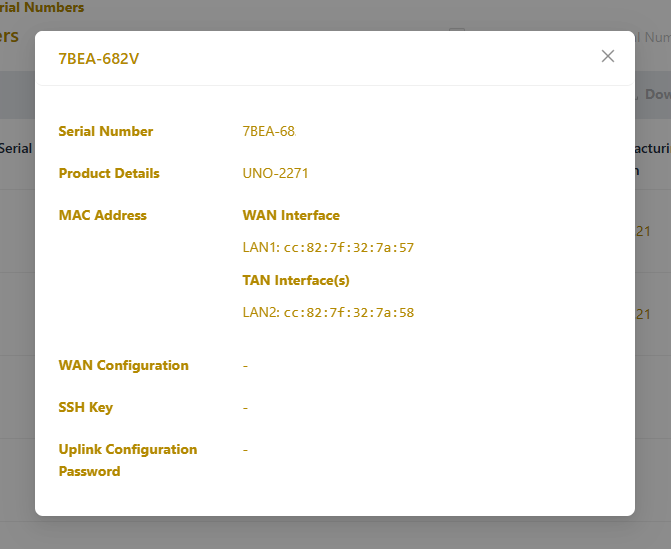
View serial number and manufacturing information
From the left menu of the Secure Edge Portal, select Nodes > Serial Numbers. This page lists all unassigned serial numbers (devices not yet associated with an Edge Node) along with the vendor details, product details, manufacturing information, and serial number issuer and expiration.
.png)
Select an item in the list to see detailed networking information.
Viewing MAC address information
MAC address information is available for a node's physical interfaces, LAN networks, and services. You can view these MAC addresses in multiple places.
View a consolidated list of MAC addresses
On the node details page, there is a MAC table tab. Select this tab to view a consolidated list of the following:
- MAC addresses for the physical interfaces on the node
- MAC addresses for the node’s interface to each LAN network created
- MAC addresses associated with each service that is currently running on the node
To export the table data as a CSV file, select Export All.
View MAC addresses for a node's physical interfaces
You can the view the MAC addresses for a node’s physical interfaces under the Interfaces tab. The MAC address is listed in the Hardware Address column.
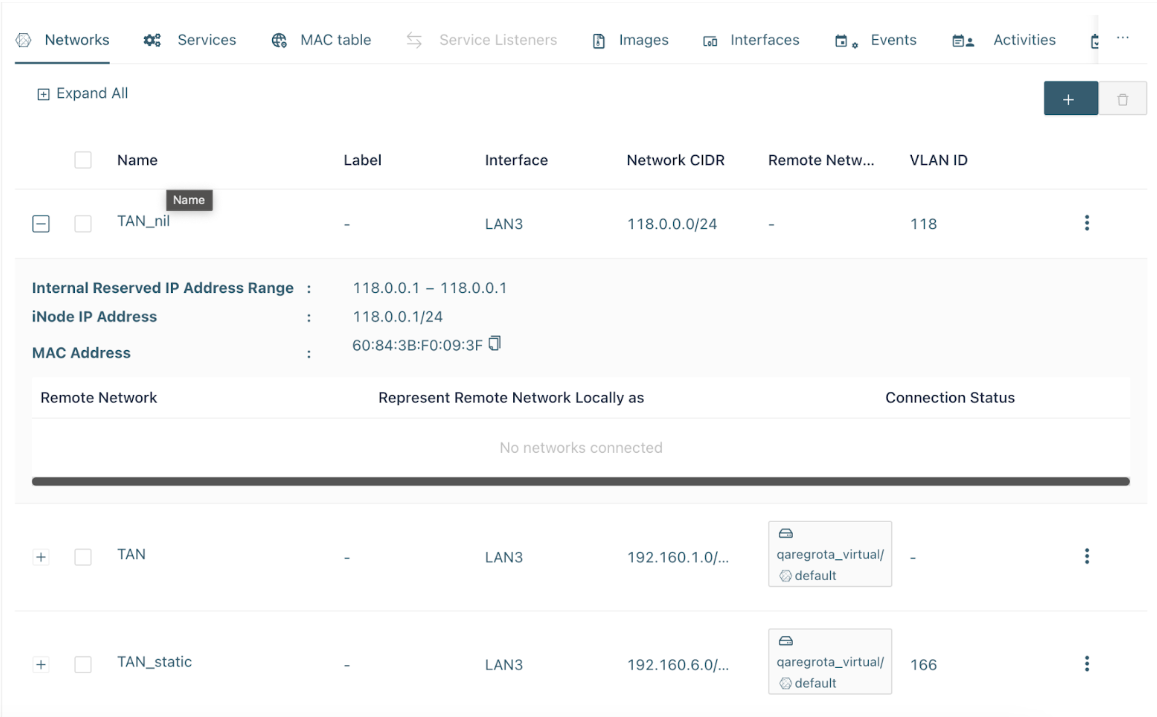
View MAC addresses for a LAN network
Each LAN network has a virtual interface created for it on the node. To view the MAC addresses for a node's interface to a LAN network, select the Networks tab and then select the plus sign (+) to expand the LAN details.
View MAC addresses for a service
To view the MAC address for a service, select the Services tab. A service may have multiple MAC addresses if it is assigned to multiple networks.
MAC address allowlisting best practices
For networks that require a MAC address allowlist, follow these best practices:
Uplink (northbound) allowlisting:
- Add the MAC addresses for the interfaces assigned to the WAN function under the Interfaces tab.
- If WAN HA is enabled, make sure you add both WAN MAC addresses to the allowlist.
LAN network (southbound) and services allowlisting:
- Add the each LAN MAC address, listed on the Networks tab.
- For each service running on the node, add its associated MAC address listed on the Services tab.