You can view service logs from the node details page in the Secure Edge Portal.
Access service logs
- In Secure Edge Portal, select Nodes > All Nodes, and then select the node to open its details page.
- In the Services tab, select the Service Logs icon for the service you want to view.
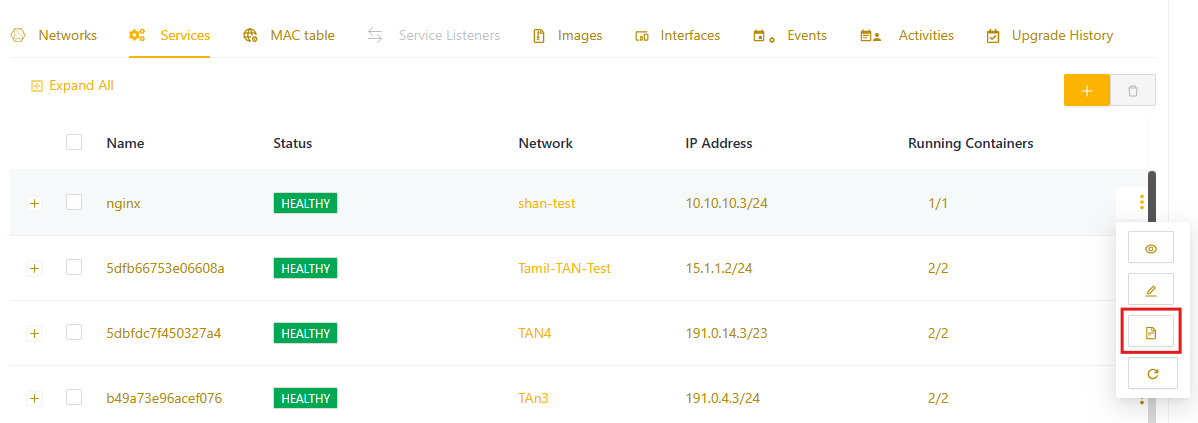
- The Service Logs window opens.
Working with logs
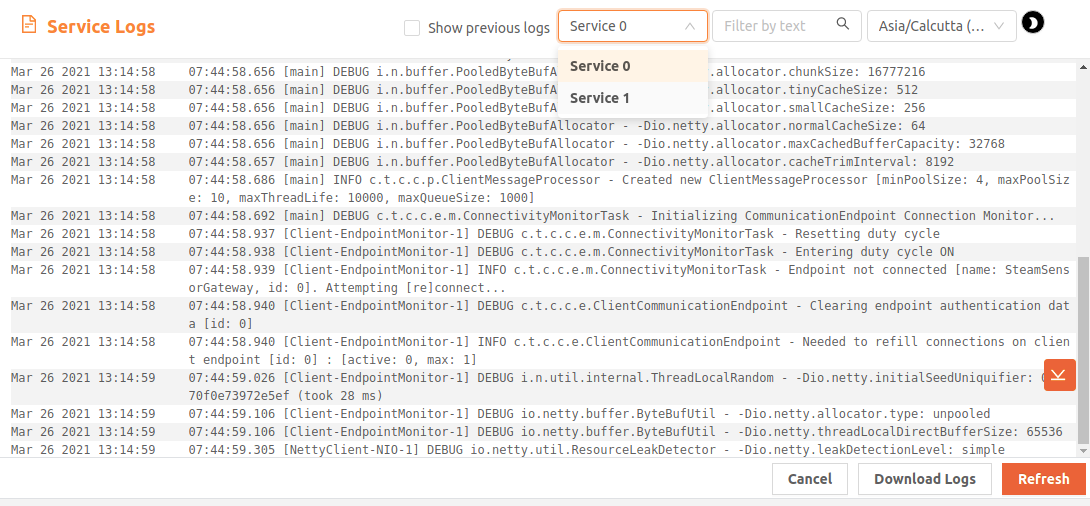
By default, the logs for the first container in the service are displayed. Use the dropdown menu to filter by service container or use the Filter by text option to search for specific content within the logs.
If the service has restarted and you need to view logs from the previous run, select the Show previous logs checkbox. This will display logs from the previous instance of the container.
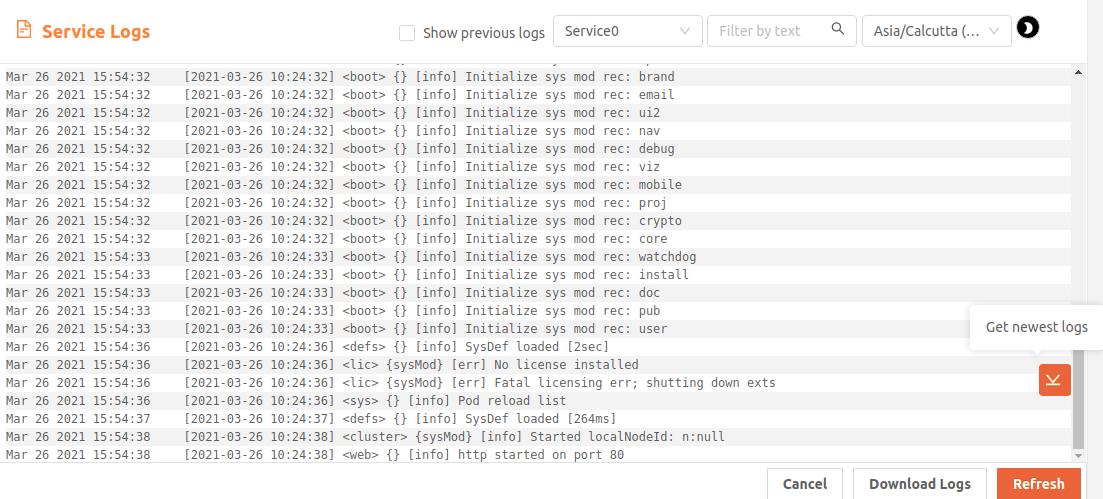
Select Get oldest logs (icon near the scroll bar, shown in the example below) to jump to the earliest logs. Select Get newest logs to jump to the most recent logs.
Additional Actions:
- Download Logs: Select this option to download the log file.
- Refresh: Click Refresh to reload the log file.
By default, logs are displayed with a light background. You can toggle between light and dark mode using the sun/moon icon.
Log timestamp and timezone settings
Service logs display timestamps according to your account's timezone setting, which defaults to the timezone set in your browser. To change the displayed timezone, use the timezone dropdown at the top right of the log window. To view or modify your account's timezone, go to My Account > My Profile in the left menu.