Threat Intelligence provides continuous monitoring of network traffic across your Edge Nodes (formerly Edge iNodes) and Virtual Edge Nodes (formerly Virtual Edge iNodes) for anomalies. It automatically detects and reports vulnerabilities in traffic patterns, helping you secure your environment. You can activate Threat Intelligence on individual nodes or clusters, configure notifications, and review findings through the Secure Edge Portal.
Configure Threat Intelligence
To enable Threat Intelligence for a node or cluster:
- In the Secure Edge Portal, select All Nodes or Clusters, and then select the specific node or cluster.
- From the Manage Node or Manage Cluster menu (top-right), select Edit > Advanced Settings.
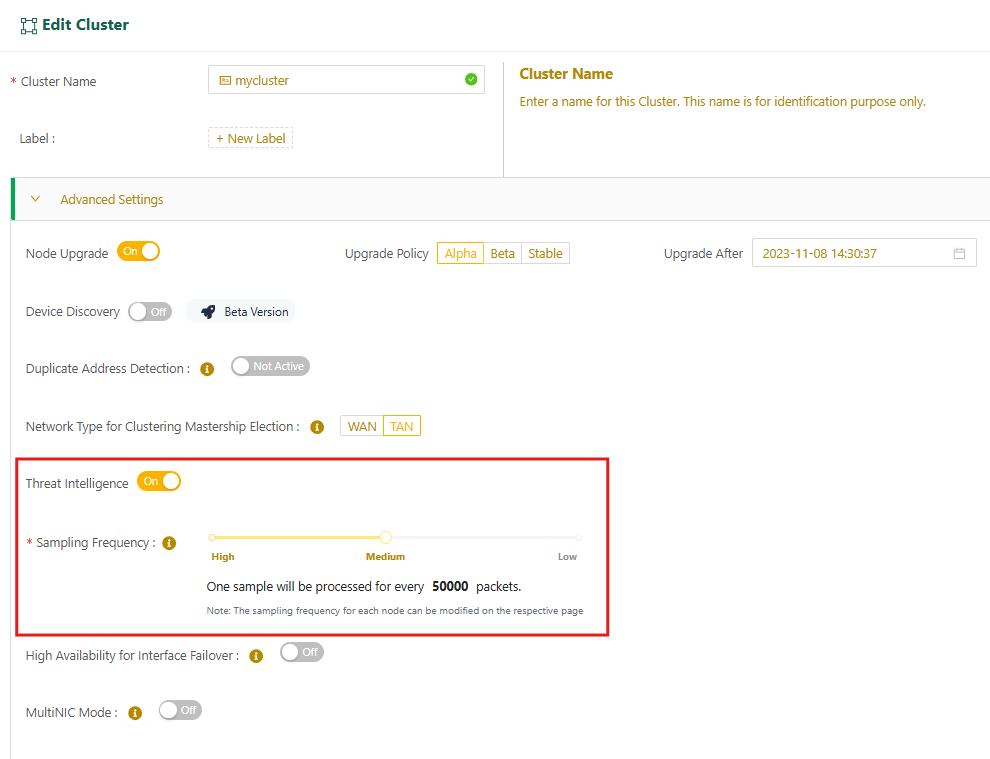
- Toggle Threat Intelligence to On.
- Set the sampling frequency to determine the rate of network traffic sampling, ranging from 1 sample per 5,000 packets (high frequency) to 1 sample per 100,000 packets (low frequency).
- Select Update to apply your changes.
The following image shows an example configuration at the cluster level.
Review Threat Intelligence findings
Once Threat Intelligence is enabled, you can review findings in threats overview charts and detailed Threat Intelligence dashboards.
Threats overview
This summary chart is available on the node details page and your organization’s dashboard, and shows the top three threats detected in the last seven days, by count. You can view this at the node level or across all nodes in your organization, including any child organizations.
The following example shows the threat overview chart on an individual node details page.
.png)
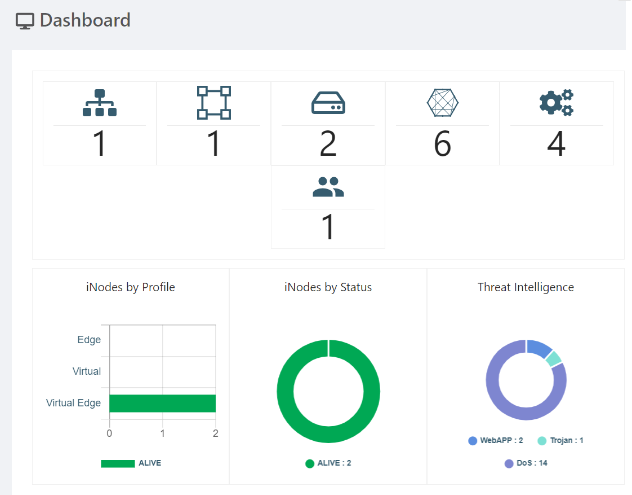
To see a threat overview across all nodes in your organization and its child organizations, go to the Dashboard, as show in the following example.
Threat Intelligence dashboard
For a more detailed view, click on the threat overview chart to open the Threat Intelligence dashboard. This dashboard groups threats by network parameters and severity levels (High, Medium, Low). High-severity threats include admin access breaches or web application attacks. Medium threats might involve suspicious login attempts or unusual filenames, and low-severity threats could involve network scans or suspicious traffic.
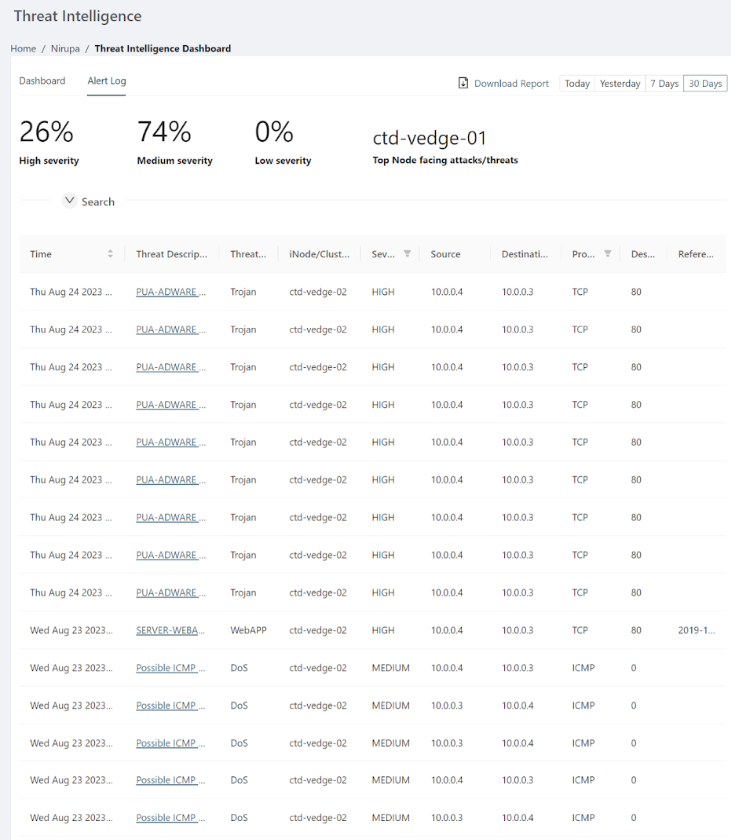
The following example shows the Threat Intelligence dashboard for an organization, with a selected time period of 30 days (top-right corner).
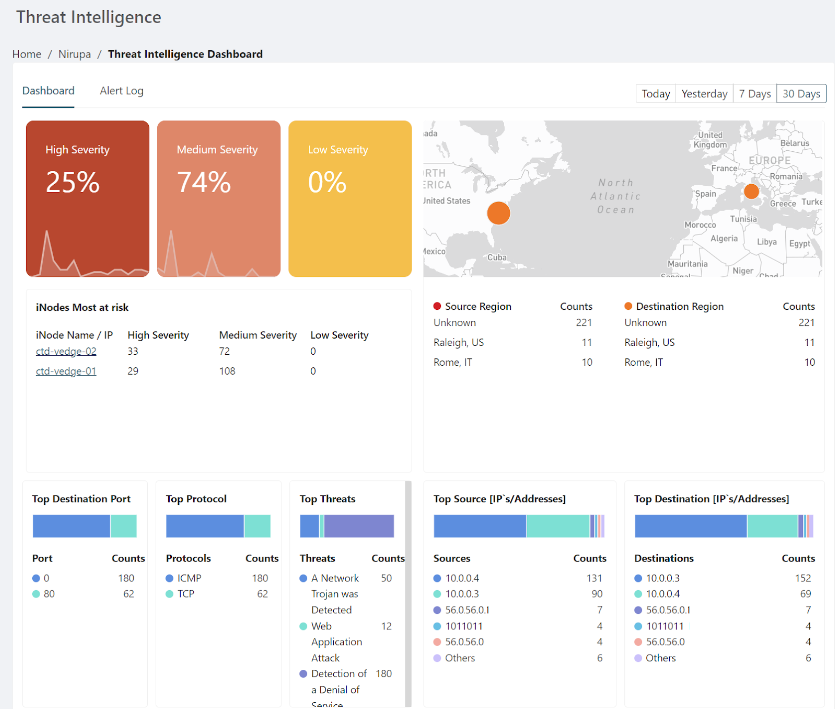
The severity percentage reflects the percentage of each severity type against the total number of issues. For example, if an inspection of 500 packets identifies 80 problematic packets, and 40 of those are medium severity, the dashboard would show 50% medium severity.
If there are no threats detected in the specified time period, the threats dashboard will display statistics information.
.png)
The dashboard includes an alert log where you can search/filter across threats detected in the specified period and download reports (CSV).
Configure alerts
You can configure alerts in the Secure Edge Portal and subscribe to Threat Intelligence notifications via email or webhook. For detailed instructions, see Using Alerts.
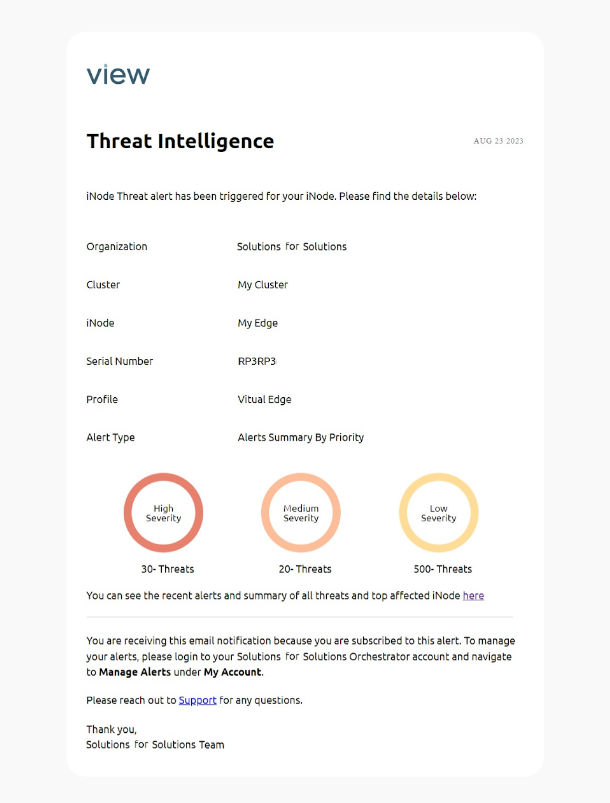
Once configured, you will receive two types of alert notifications:
- Daily notifications (at 6:00PM EDT/EST) with a threat count summary for each node
- Instant notifications for high-priority threats detected in the node
The following image shows an example email notification.